Reports BETA
Dashboards Navigation Panel: The left sidebar lists all available reporting dashboards within the Analytics module (e.g., Processing Exceptions, Upload Chain of Custody, Upload Dashboard, Upload Exception Report). Click any dashboard name to switch views. Use the Search field to filter by name, and the Sort and Category dropdowns to organize the list. Use the left justify icon to open and close the navigation panel.
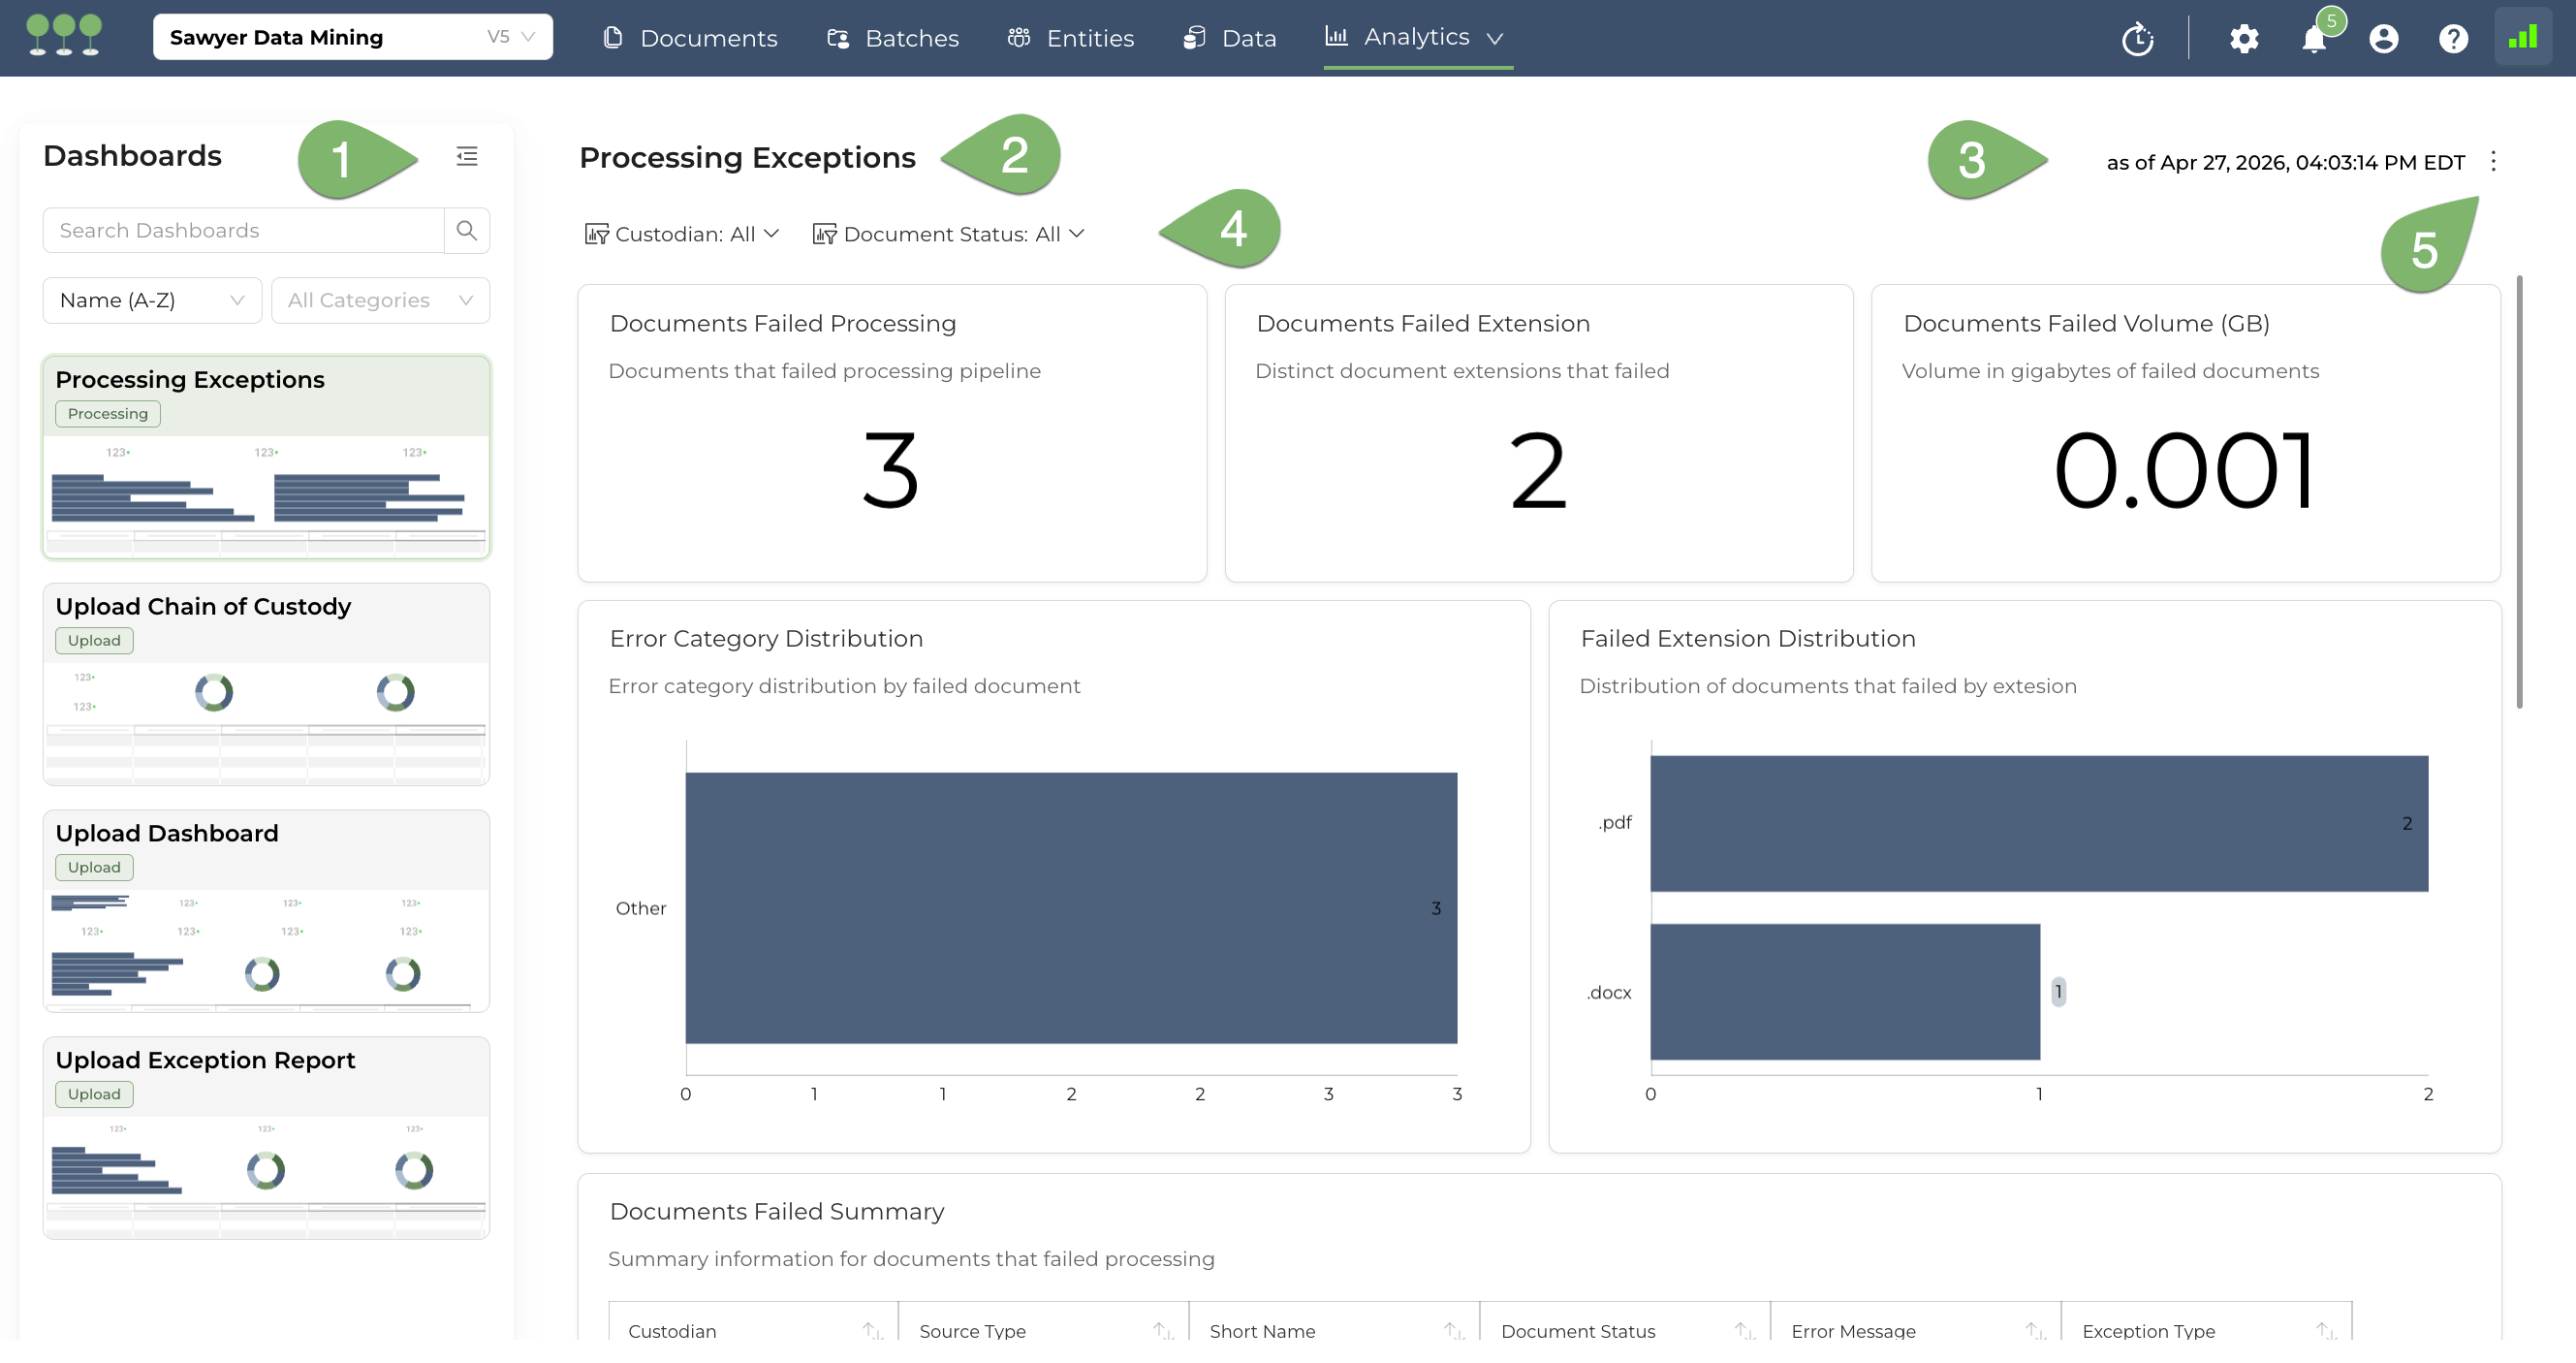
Dashboard Title: Displays the name of the currently selected dashboard. This confirms which report you are viewing and corresponds to the selected item in the Dashboards Panel.
Data Freshness Timestamp: Shows the exact date and time the dashboard data was last refreshed (e.g., “as of Apr 27, 2026, 04:03:14 PM EDT”). Use this to verify that the metrics reflect the most current state of processing.
Dashboard Filters: Interactive filter controls that scope the dashboard data. In this example, use Custodian to isolate exceptions for a specific data source owner, and Document Status to narrow results by processing state (e.g., Failed, Finished). All visualizations and metrics below update dynamically based on the selected filters.
Actions Menu: The kebab menu (three-dot icon) provides two actions — Refresh and Download:
- Refresh: Reloads the dashboard data to reflect the most current processing state.
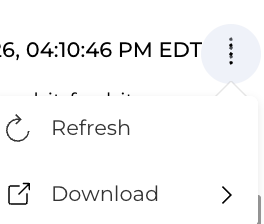
- Download: Downloads the dashboard data in a selected format.
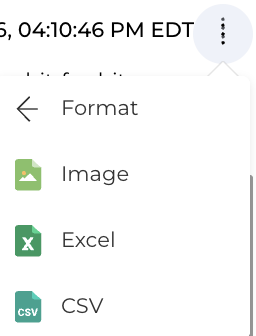
- Image: Exports the current dashboard view as a PNG image for use in presentations or status reports.
- Excel: Exports the underlying dashboard data as an Excel spreadsheet for offline analysis or record-keeping.
- CSV: Exports the underlying dashboard data as a CSV file for integration with external tools or compliance archives.
- Refresh: Reloads the dashboard data to reflect the most current processing state.
The project Upload Dashboard serves as the central command center for uploading data to Canopy. It provides real-time visibility into how raw client data is being ingested, filtered, and prepared for processing.
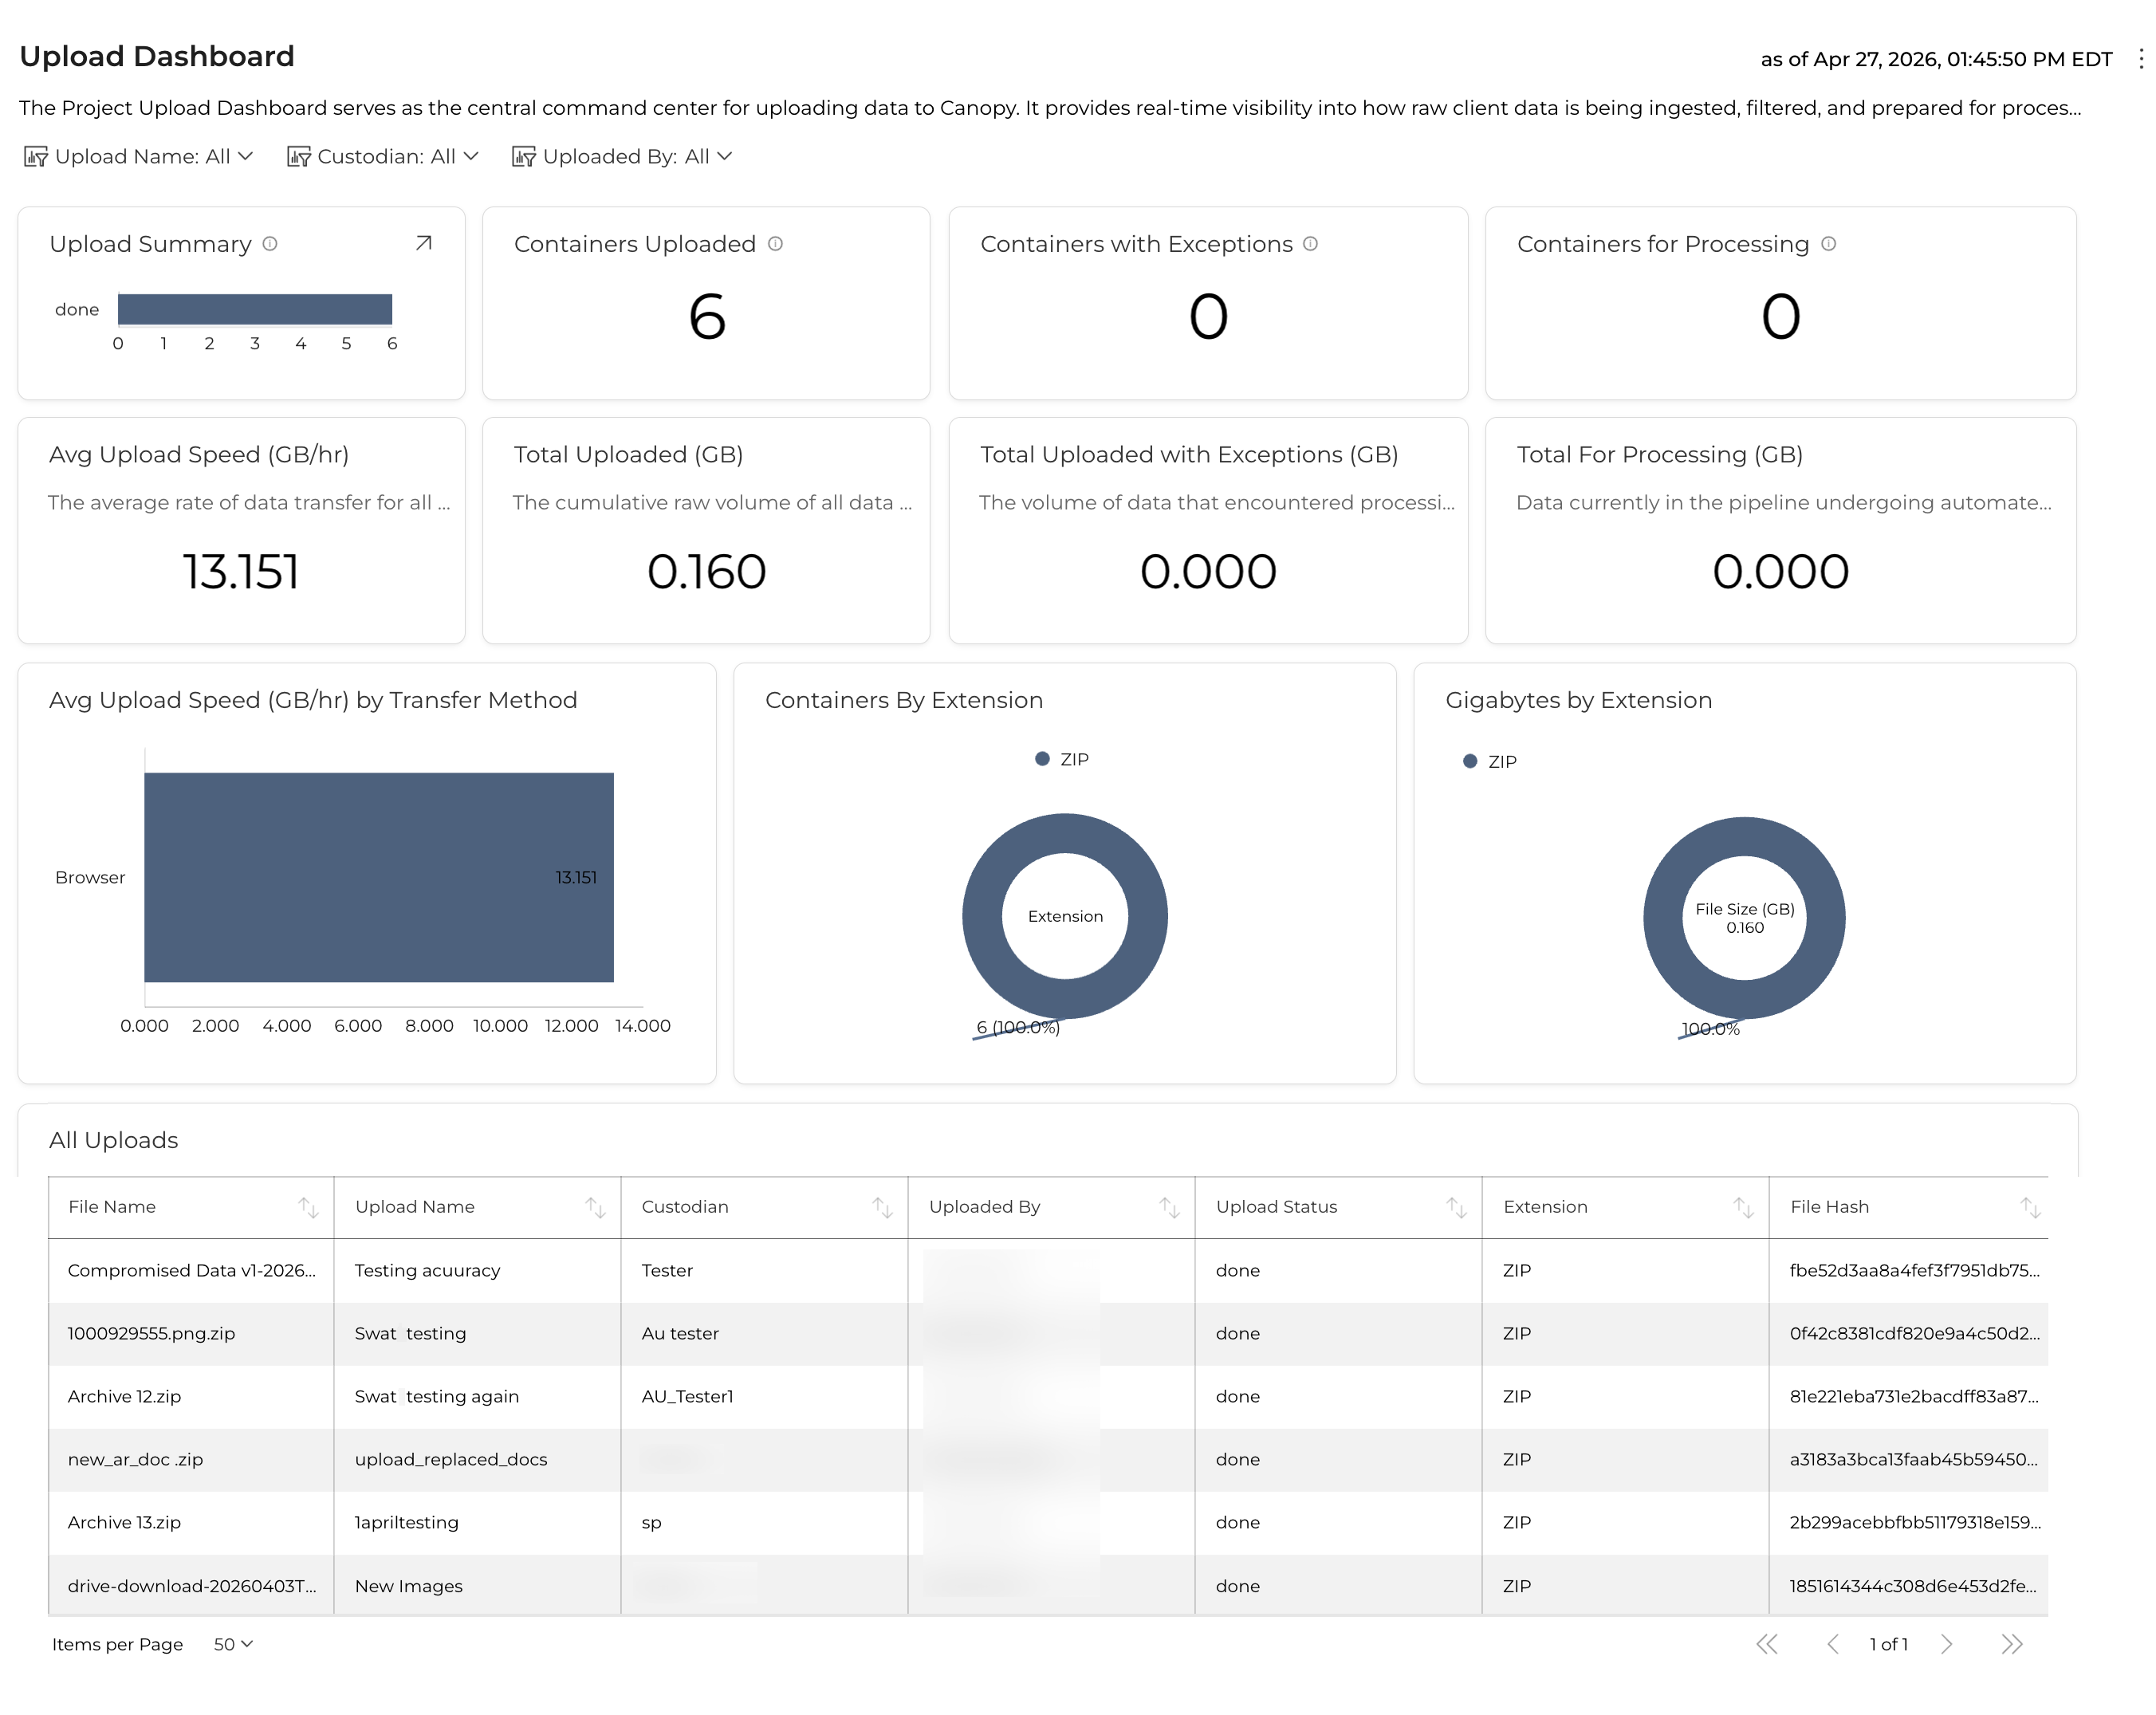
These KPIs represent the aggregate status of data within the specific project. They are used to validate ingestion against client manifests and to estimate timelines for the future uploads.
| Metric Title | Definition |
|---|---|
| Upload Summary | A count-based metric showing the total number of individual files currently residing in each system state (Uploaded, Queued, Processing, Failed, Finished). |
| Containers Uploaded | A count of compound or compressed files (e.g., .PST, .ZIP, .7z) successfully transferred. These require extraction before individual file processing can begin. |
| Containers with Exceptions | A count of containers that failed to fully extract or process. This includes files flagged as Failed, Deduplicated, Infected, Password Protected, or Corrupted. |
| Containers for Processing | A count of containers that have successfully moved into the processing phase after extraction. |
| Total Uploaded (GB) | The cumulative raw volume of all data sources transferred into this project. |
| Total Uploaded with Exceptions (GB) | The volume of data that encountered processing errors and requires manual remediation. |
| Total For Processing (GB) | Data currently in the pipeline undergoing automated PII/PHI detection, de-NISTing, and deduplication. |
| Avg Upload Speed (GB/hr) | The average rate of data transfer for all active and completed sessions in this project. |
Canopy provides deep-dive insights into the structural composition of the project’s data set.
This insight provides a count of Containers for Processing categorized by their file extension (e.g., .pst, .zip, .ost).
- Usage: Helps identify if the project is “email-heavy” (high
.pstcount) or “archive-heavy” (high.zipcount). - Workflow Impact: Large numbers of email containers typically require more time for the PII detection engine to traverse nested message threads.
This insight tracks the volume of data within the Containers for Processing phase, grouped by extension.
- Usage: Provides a more accurate picture of processing load than file counts alone. A single 50GB
.pstfile represents a significantly higher processing load than 500 one-megabyte.zipfiles. - Predictive Value: Use this to estimate the remaining time in the Processing phase based on historical system throughput for specific file types.
This section lists individual upload sessions.
- Validation: Compare the Total Uploaded (GB) against the client’s original data manifest.
- Container Tracking: Monitor the Containers Uploaded count to gauge structural complexity.
The Avg Upload Speed (GB/hr) can be filtered or viewed by the following methods:
- Browser: Standard direct upload via the Canopy web interface.
- Progress ShareFile: Integrated ingestion from ShareFile environments.
- Microsoft 365: Direct cloud-to-cloud transfer from M365 tenants.
- AWS S3 Pre-Signed URL: High-speed ingestion via secure Amazon S3 links.
- Azure Storage Shared Access Signatures (SAS): Secure ingestion from Azure Blob storage.
- Queue Health: Monitor Containers for Processing and the Processing Insights to ensure compound files are being deconstructed and handed off to the PII detection engine.
- File Progression: Use the Upload Status metric to see if files are moving steadily into
Processing.
Cloud-to-cloud methods (M365, AWS S3, Azure SAS) typically yield higher Avg Upload Speeds than Browser-based uploads, which are limited by local network upload bandwidth.
The Containers with Exceptions and Total Uploaded with Exceptions (GB) metrics highlight critical blockers.
- Exception Types:
- Failed: General processing error.
- Deduplicated: Container identified as a duplicate and skipped.
- Infected: File flagged as virus-infected.
- Password Protected: Requires a password from the client to extract content.
- Corrupted: File structure is broken; requires repair or re-export.
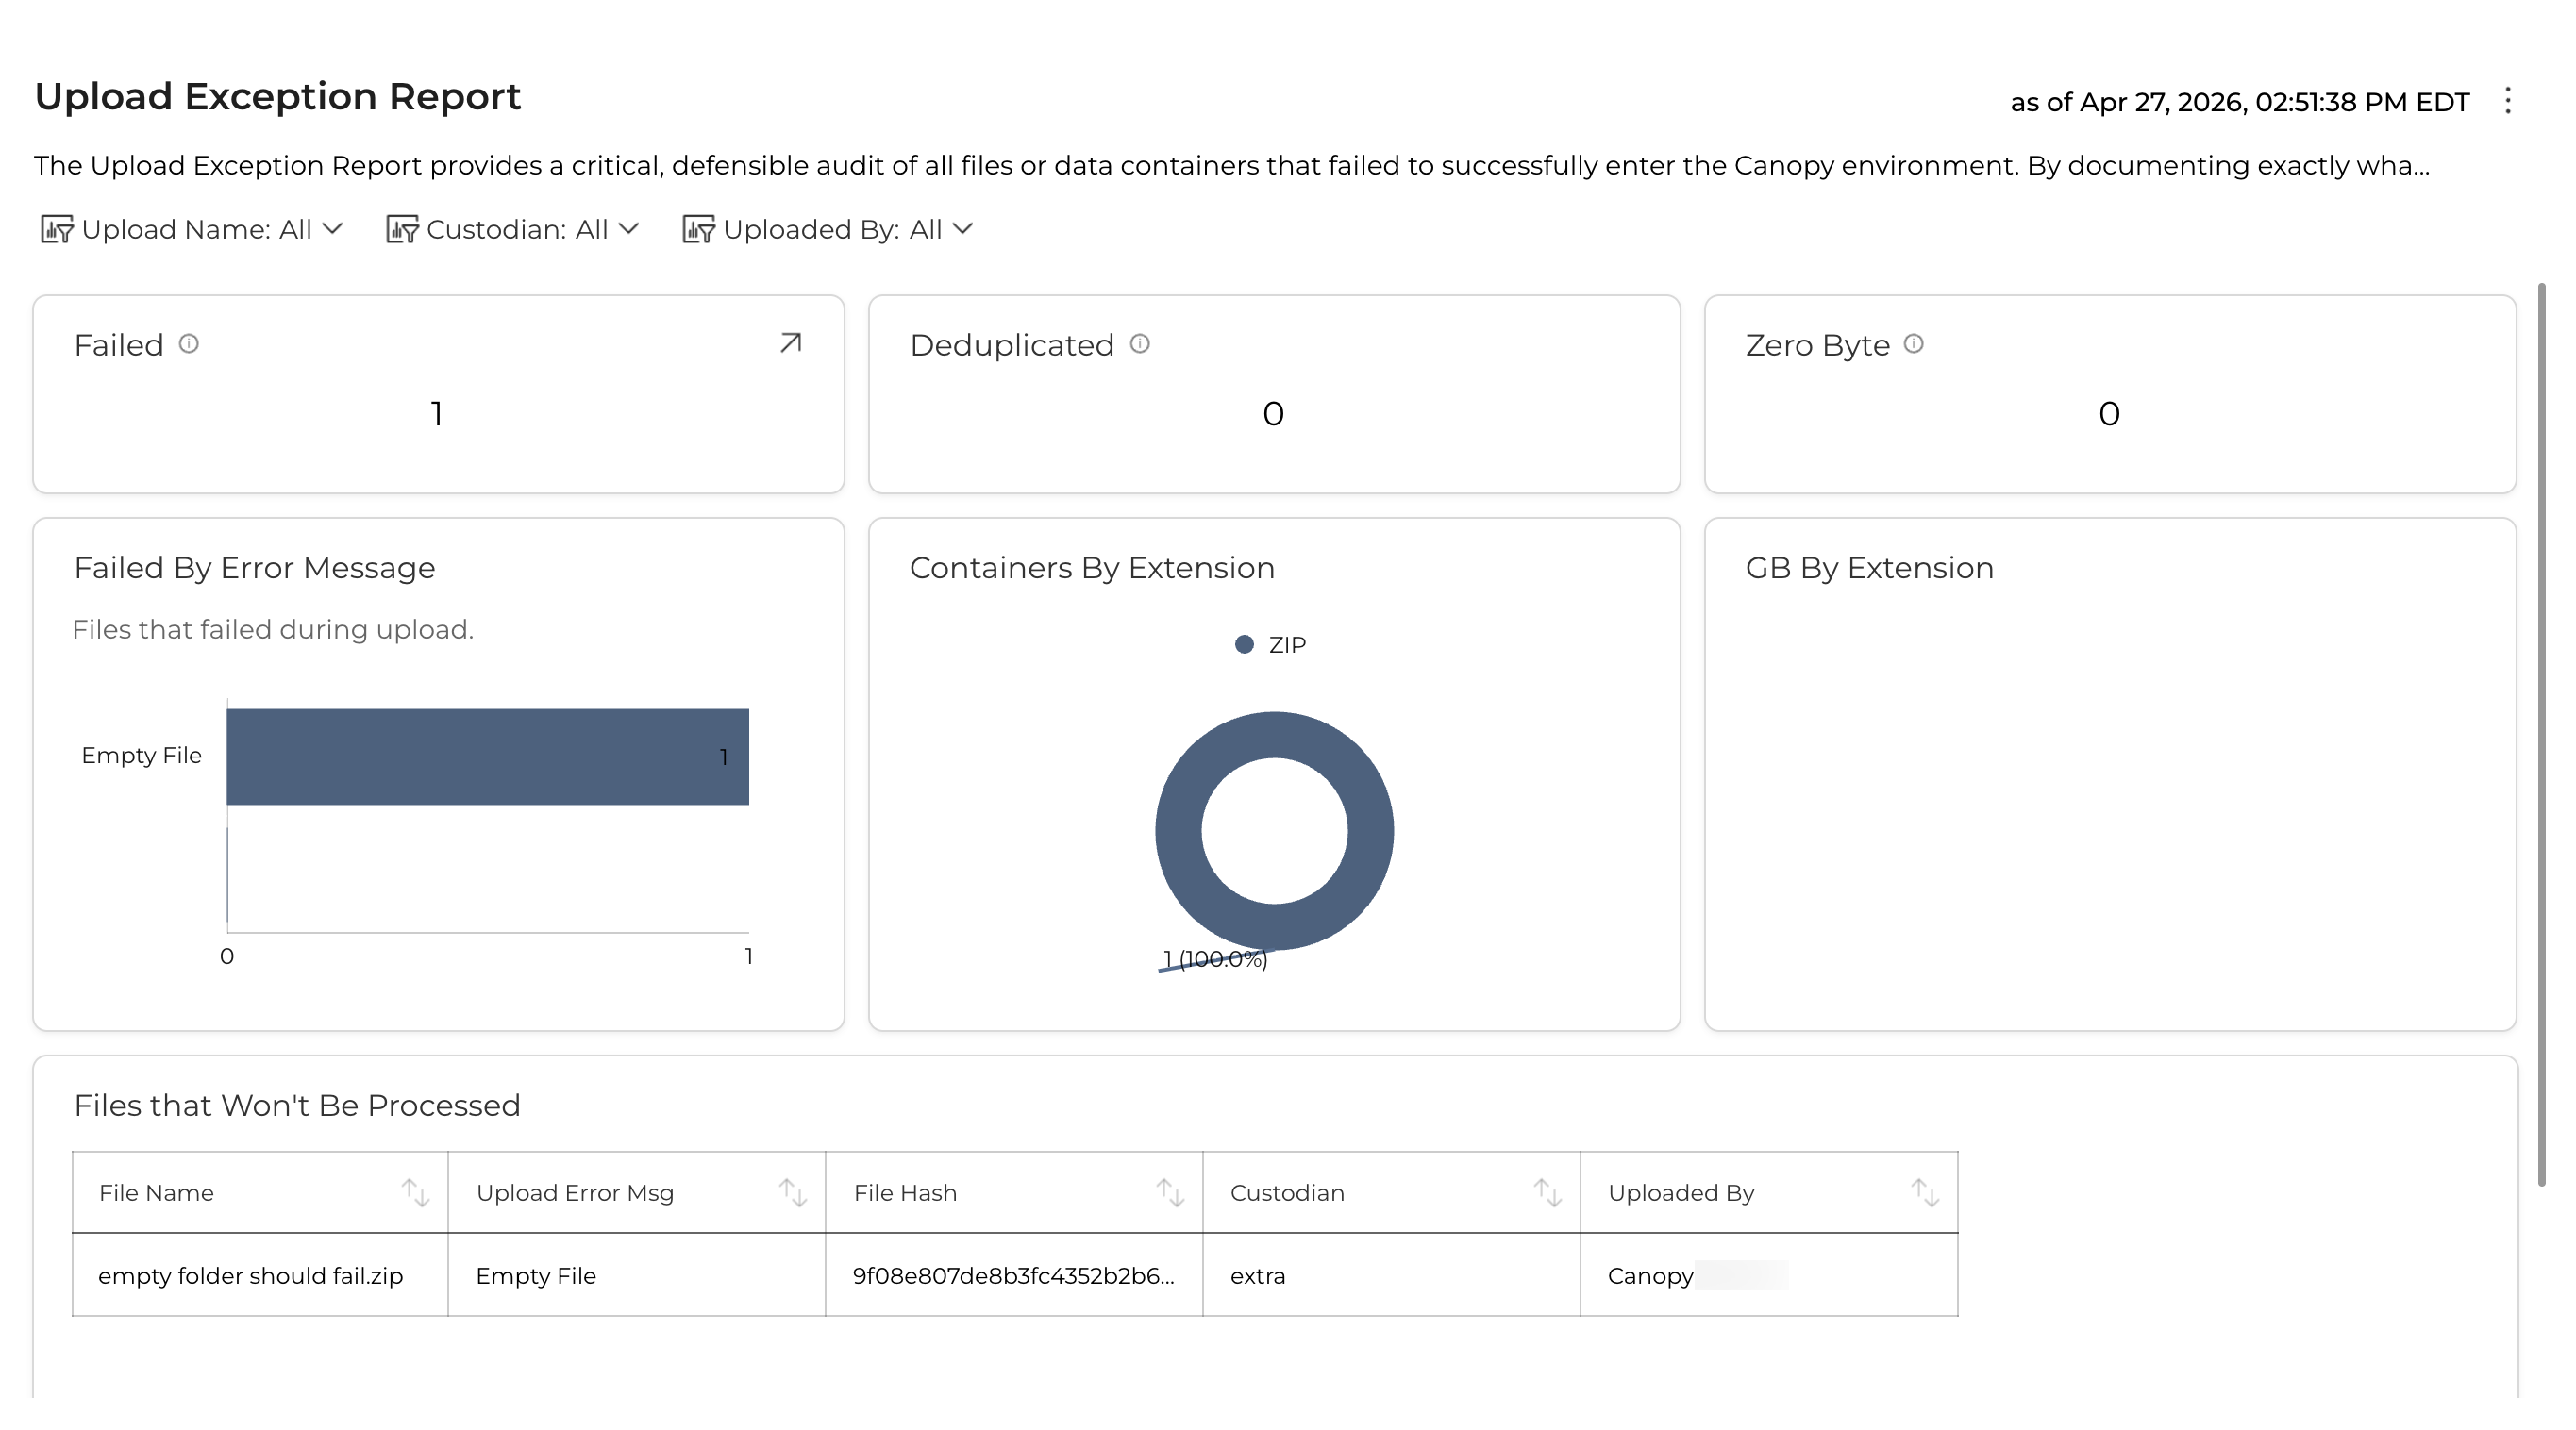
The Upload Exception Report provides a critical, defensible audit of all files or data containers that failed to successfully enter the Canopy environment. By documenting exactly what was excluded and why—ranging from technical failures to security constraints—it ensures the overall integrity of the data population.
Access the report by navigating to the Data tab and selecting the Failed sub-tab. This dashboard serves as the central hub for the “Processing” phase of the IRDM framework.
These metrics provide a high-level audit of data excluded from the “Ready for Assessment” population. Tracking these is essential for a defensible legal discovery process.
- Failed: The count of upload containers that encountered a critical error during ingestion. This indicates a technical barrier (e.g., severe corruption or unsupported encryption).
- Deduplicated: The count of containers identified as exact cryptographic duplicates. Canopy excludes these to prevent redundant review efforts.
- Zero Byte: Containers uploaded with no data. Identifying these ensures no data was lost due to transfer errors.
- Failed GB: The total data volume of all failed containers. This is a critical metric for understanding the “data gap” or the percentage of the total breach population that remains unindexed.
The Analysis section provides a visual and categorical breakdown of exceptions to help identify systemic issues.
Categorizes failed or excluded items by file extension (e.g., .ZIP, .PST, .MSG).
Strategic Use: High failure rates in specific extensions may indicate a need for a specific parser update or global encryption issues.
Shows the “weight” of the exceptions rather than just the count.
Strategic Use: Use this to prioritize remediation. One failed 10GB
.ZIPis often more critical than 100 failed 1KB.TXTfiles.
A categorical breakdown based on root cause, distinguishing between client-side issues and technical system failures.
| Error Message | Description | Recommended Action |
|---|---|---|
| Password Protected | The file is encrypted with a password the system does not have. | Request password from provider; use Replace to upload decrypted version. |
| Corrupt File | The file structure is broken, often due to partial transfer. | Download to inspect locally; request fresh copy if unreadable. |
| Unsupported Format | The file extension is known, but the version is not supported. | Check for Canopy updates or utilize an Alt Workflow. |
| Processing Timeout | The file was too complex/large for the current processing window. | Use the Reprocess icon to attempt ingestion again. |
Canopy provides built-in tools within the Exception Details to resolve failures:
- Download: Manually inspect a document for corruption or attempt to unlock a file locally.
- Reprocess: Re-attempt ingestion for transient system issues.
- Replace: Upload a corrected version (e.g., decrypted). The system retains the original metadata association.
- Delete: Remove failed containers confirmed as redundant or irrelevant.
To generate a permanent record of exclusions:
- Click the Export Icon in the Failed tab.
- Retrieve the CSV/Excel log from the Exports section under Project Settings.
The Upload Chain of Custody ensures that the ‘Digital Chain of Custody’ remains unbroken by verifying that the data payload received in Canopy’s cloud environment is a bit-for-bit, virus-free replica of the client’s source data. This information can be reconciled against a transfer manifest to ensure zero data loss during transit.
Maintaining a defensible audit trail is critical for Project Managers and Legal Counsel. By using the metrics provided in the Upload and Processing Dashboard, teams can validate that the data matches the intended scope.
The following metrics are tracked to provide a comprehensive view of data integrity:
- Definition: Successfully uploaded containers that have transitioned to the processing phase.
- Usage: Used as the primary count to match against the number of files sent by the client or forensics team.
- Definition: A breakdown of the data formats received (e.g.,
.PST,.ZIP,.MSG,.7Z). - Usage: Helps identify if the data mix matches expectations and flags potential “hidden” data within compressed archives.
- Definition: The exact data volume (in Gigabytes) of each individual file or container at the point of ingestion.
- Usage: Provides the technical proof required for “bit-for-bit” verification.
- Definition: An aggregate view of data volume sorted by file extension.
- Usage: Allows Project Managers to estimate processing timelines and potential review costs based on data density.
The digital audit trail of the files successfully transmitted to Canopy for processing. The Upload Chain of Custody Report serves as the official record of the data’s journey into the Canopy environment. This report is the primary tool used by Data Miners and Project Managers to reconcile the Upload Details within the application against the client-provided Transfer Manifest.
By verifying these fields, Canopy ensures the “Digital Chain of Custody” remains unbroken, proving that the data payload is a bit-for-bit, virus-free replica of the source data.
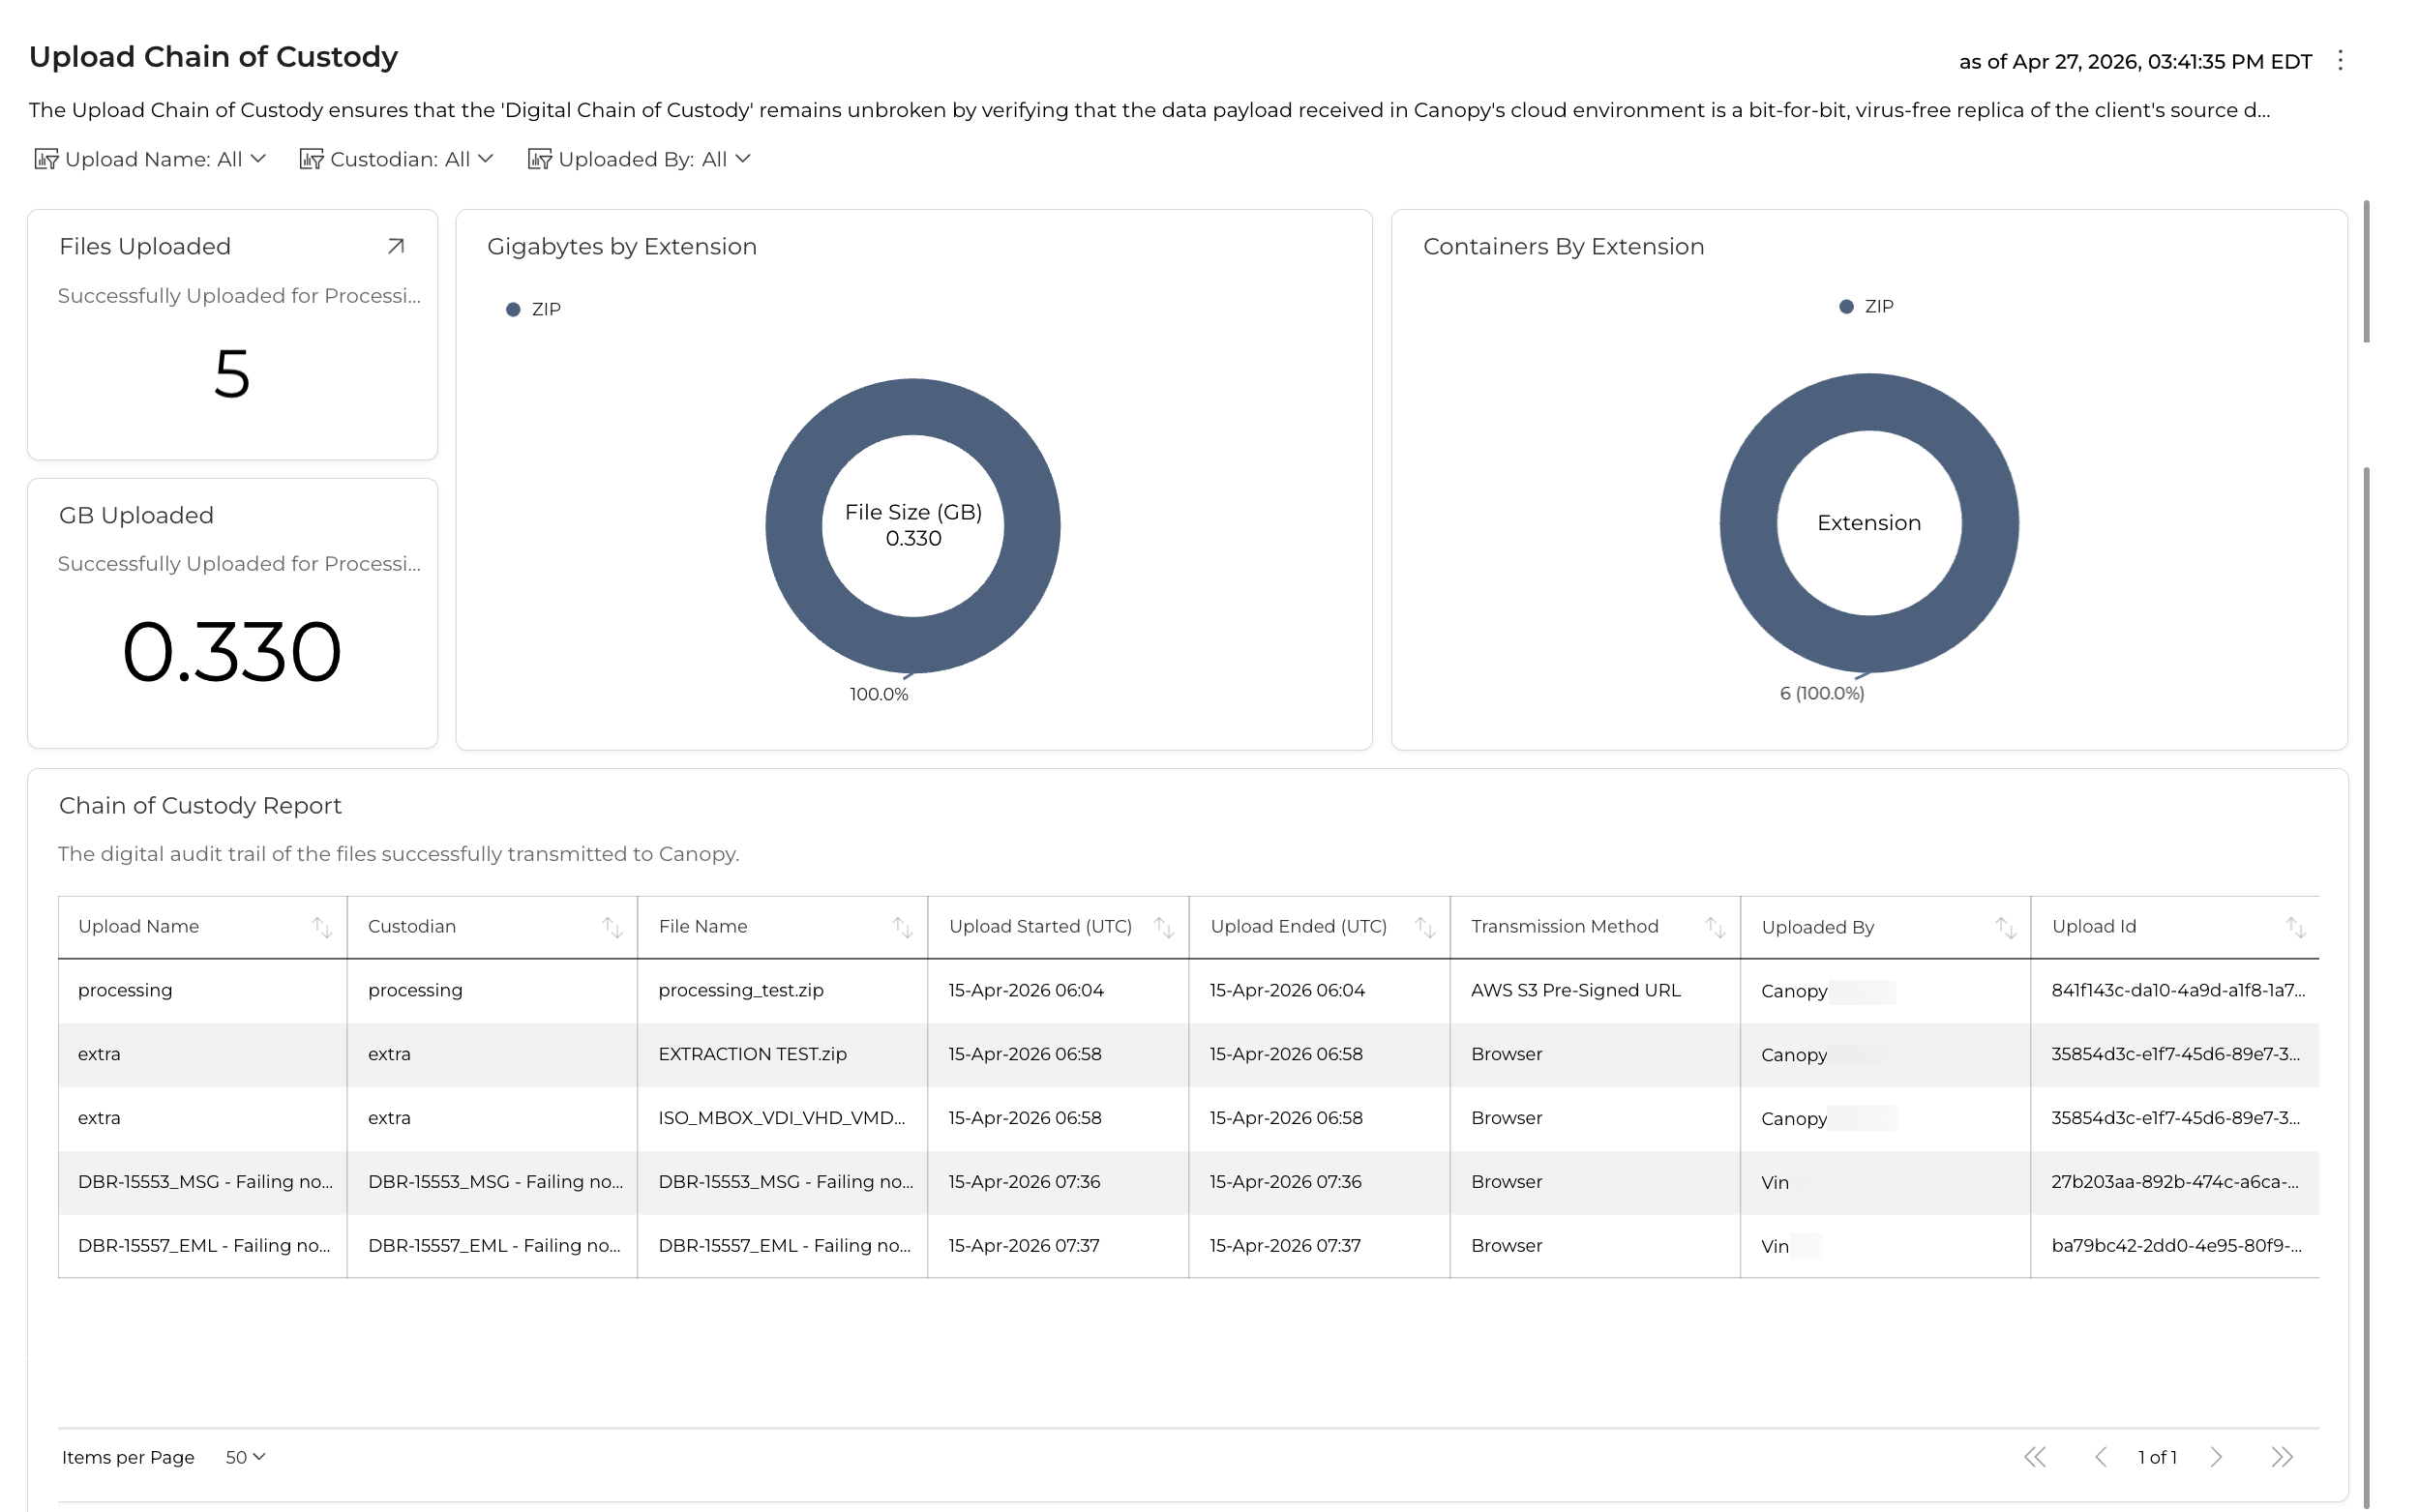
The following fields comprise the digital audit trail and should be used for formal reconciliation:
The user-defined name for the specific upload batch or folder. This usually corresponds to a specific delivery or media ID from the client.
The individual or entity identified as the owner or source of the data. This is a critical field for legal defensibility during the notification phase.
The full name of the container or document as it existed at the time of upload (e.g., Export_001.pst).
The precise timestamps (Date and Time) marking when the transmission began and when the file was fully received in the cloud environment. These timestamps document the “Transit” window.
The technical avenue used to ingest the data (e.g., Web Upload, SFTP, or Direct Cloud-to-Cloud transfer).
The account name of the professional who initiated the upload. This provides accountability for who handled the data upon receipt.
A unique system-generated identifier for the upload session. This ID is used to track the data through the Processing and Assessment modules.
The exact size of the file in Gigabytes.
- Verification Note: This must match the size listed on the Transfer Manifest to prove that no data truncation or packet loss occurred.
The cryptographic hash (digital fingerprint) of the file.
- Verification Note: A matching SHA 256 hash between the source and Canopy is the gold standard for proving that the file was not altered, corrupted, or tampered with during transit.
This report is the primary instrument for managing technical integrity and defensibility during the processing phase of a Canopy Incident Response Data Mining (IRDM) project. Use these metrics to confirm the status of critical processing milestones.
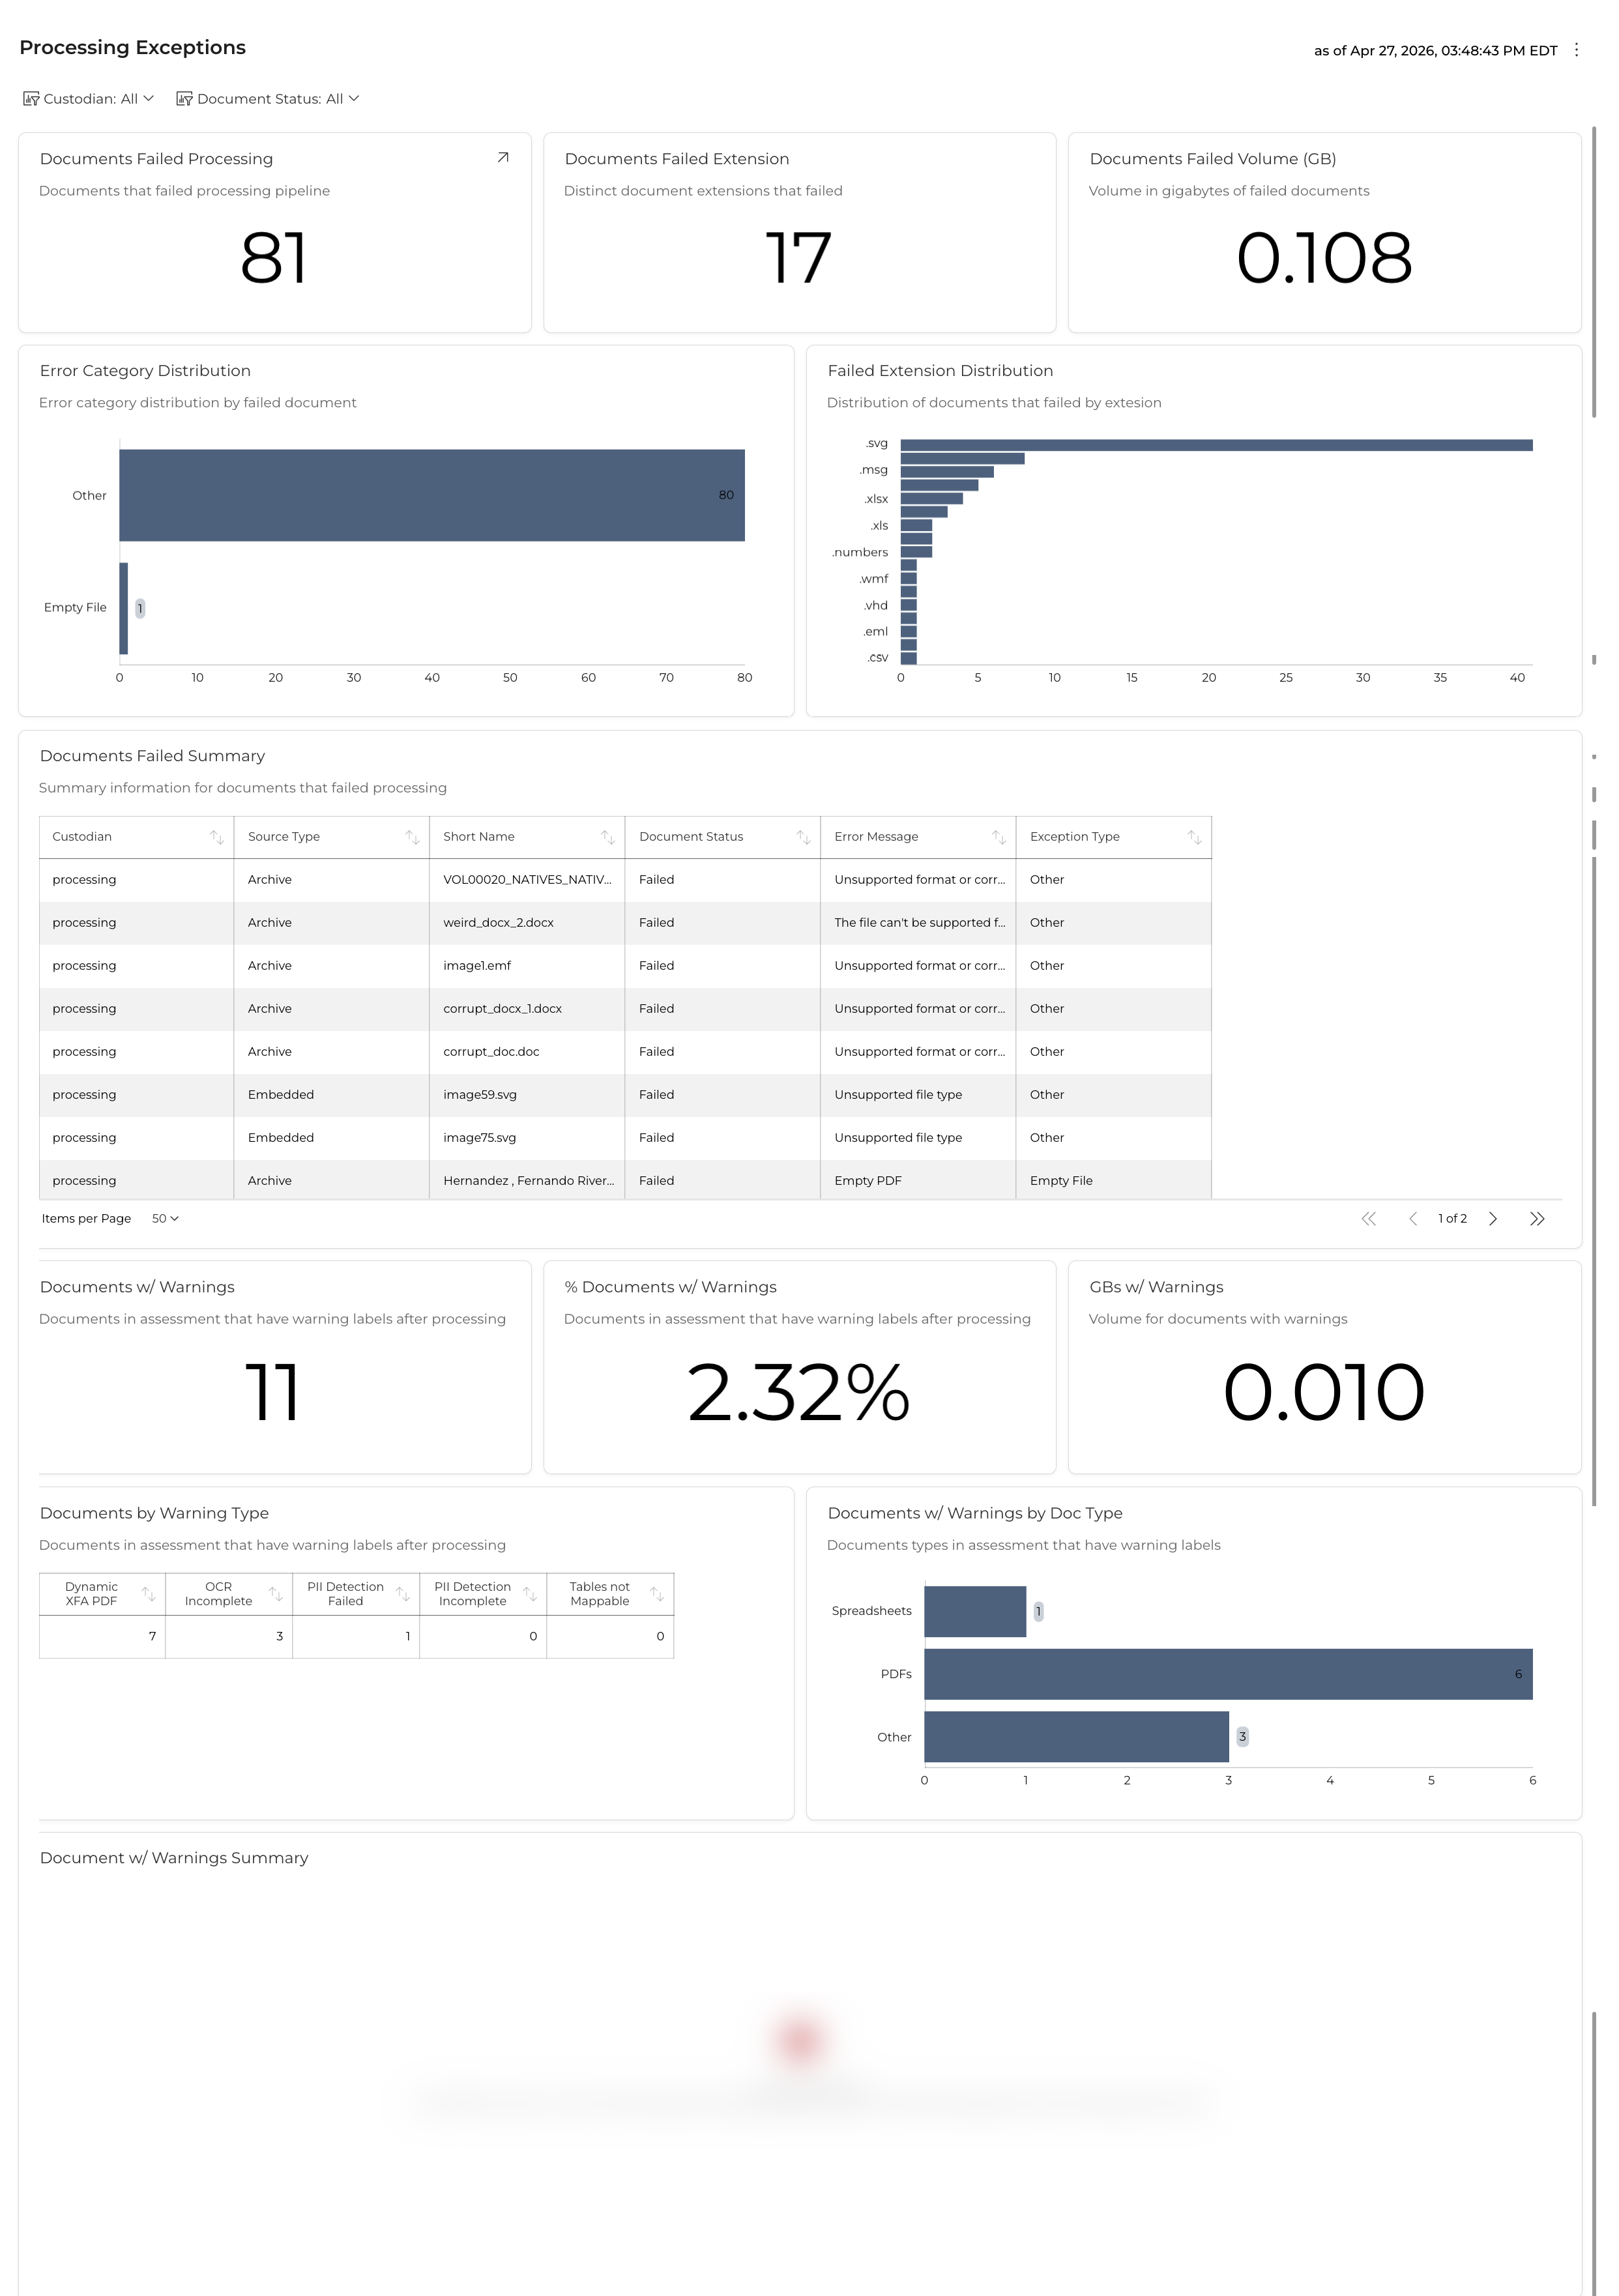
Critical errors identify documents that failed to process. These files are not available in the Document List and require immediate remediation by the Project Manager or Data Miner.
These KPIs provide a high-level summary of processing failures across the project:
| Metric Title | Definition |
|---|---|
| Documents Failed Processing | Total count of documents that failed the processing pipeline. Click the drill-through icon to view the underlying data. |
| Documents Failed Extension | The number of distinct file extensions represented among the failed documents. A high count may indicate broad compatibility issues. |
| Documents Failed Volume (GB) | The total data volume of all failed documents. Use this to assess the scale of the data gap in the reviewable population. |
A horizontal bar chart showing the proportional breakdown of failures by error category (e.g., Other, Empty File). Use this to quickly identify whether failures are concentrated in a single category or spread across multiple root causes.
A horizontal bar chart displaying the count of failed documents grouped by file extension (e.g., .svg, .msg, .xlsx, .xls, .numbers, .wmf, .vhd, .eml, .csv). Use this to pinpoint problematic file types and determine whether a parser update or format conversion is needed.
A paginated data grid listing each failed document with the following columns:
| Column | Description |
|---|---|
| Custodian | The data source owner associated with the failed document. |
| Source Type | The origin format of the document (e.g., Archive, Embedded). |
| Short Name | The file name of the failed document. |
| Document Status | The current processing state (e.g., Failed). |
| Error Message | The specific error returned by the processing engine (e.g., “Unsupported format or corr…”, “Unsupported file type”, “Empty PDF”). |
| Exception Type | The classification of the exception (e.g., Other, Empty File). |
| Error Category | Identification | Mitigation Action |
|---|---|---|
| System Error | Encountered during tasks like PII detection or OCR. | Select files in the Failed tab and click the Reprocess Icon. |
| Corrupted | File structure is unreadable by the engine. | Use the Download Icon to inspect locally. If critical, use Upload Icon to provide a clean replacement. |
| Encrypted / Password Protected | Data is locked (common in PSTs, ZIPs, or Office docs). | Decrypt the file locally with the known password, then use the Upload Icon to replace the encrypted version. |
| Unsupported | File extension/format is not recognized by the engine. | Verify if the extension is relevant. Convert to a supported format (e.g., PDF) and re-upload if necessary. |
Warnings indicate files that successfully processed but may have missing data layers or require specialized viewing. These files are in the Document List but may require “Alt Workflow” handling.
| Metric Title | Definition |
|---|---|
| Documents w/ Warnings | Total count of documents in Assessment that have warning labels after processing. |
| % Documents w/ Warnings | The percentage of the total document population that carries a processing warning. |
| GBs w/ Warnings | The total data volume of documents with warning labels. |
A summary table categorizing warnings by type:
| Warning Type | Description |
|---|---|
| Dynamic XFA PDF | Legacy proprietary PDF format where extraction is “best effort” and may present as corrupted. |
| OCR Incomplete | OCR was attempted but did not fully complete, resulting in a partial or missing text layer. |
| PII Detection Failed | The PII/PHI detection engine encountered an error on the document. |
| PII Detection Incomplete | PII scanning started but did not finish, leaving potential PII undetected. |
| Tables not Mappable | Structured table data could not be extracted or mapped to the expected schema. |
A horizontal bar chart showing the distribution of warnings across document types (e.g., Spreadsheets, PDFs, Other). Use this to identify which document categories are most affected by processing quality issues.
A paginated data grid listing each document with a warning label, providing the same column structure as the Documents Failed Summary for consistent review and triage.